I shipped the maintenance mode that cost the business money
Team. One frontend team, three backend teams supporting it, Product Owners, and Sales weekly. A service designer from Munich for the first phase.
Parts and service were the second largest income line. I argued for letting fleets hide their data from the dealer network, and built that as a real mode rather than a switch. Across one frontend team, three backend teams, a service designer in Munich, and Sales in the room every week.
Subscriptions also grew 1 to 2% a week. Session time and usage rose, confirmed in Google Analytics and a customer survey, but I do not have those figures to publish.
The situation
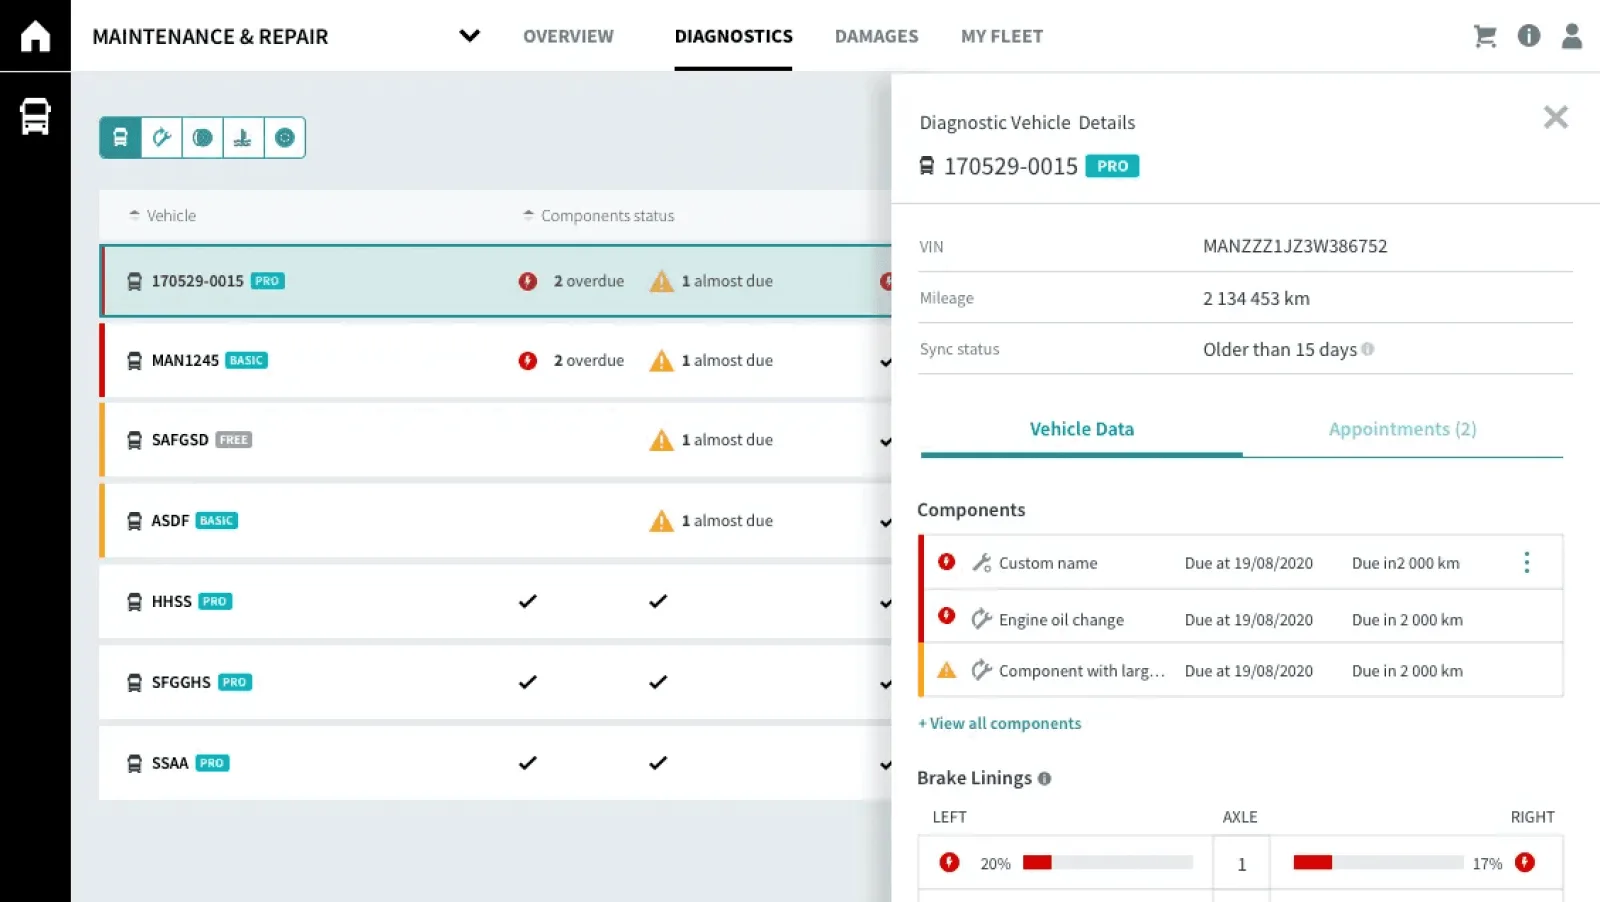
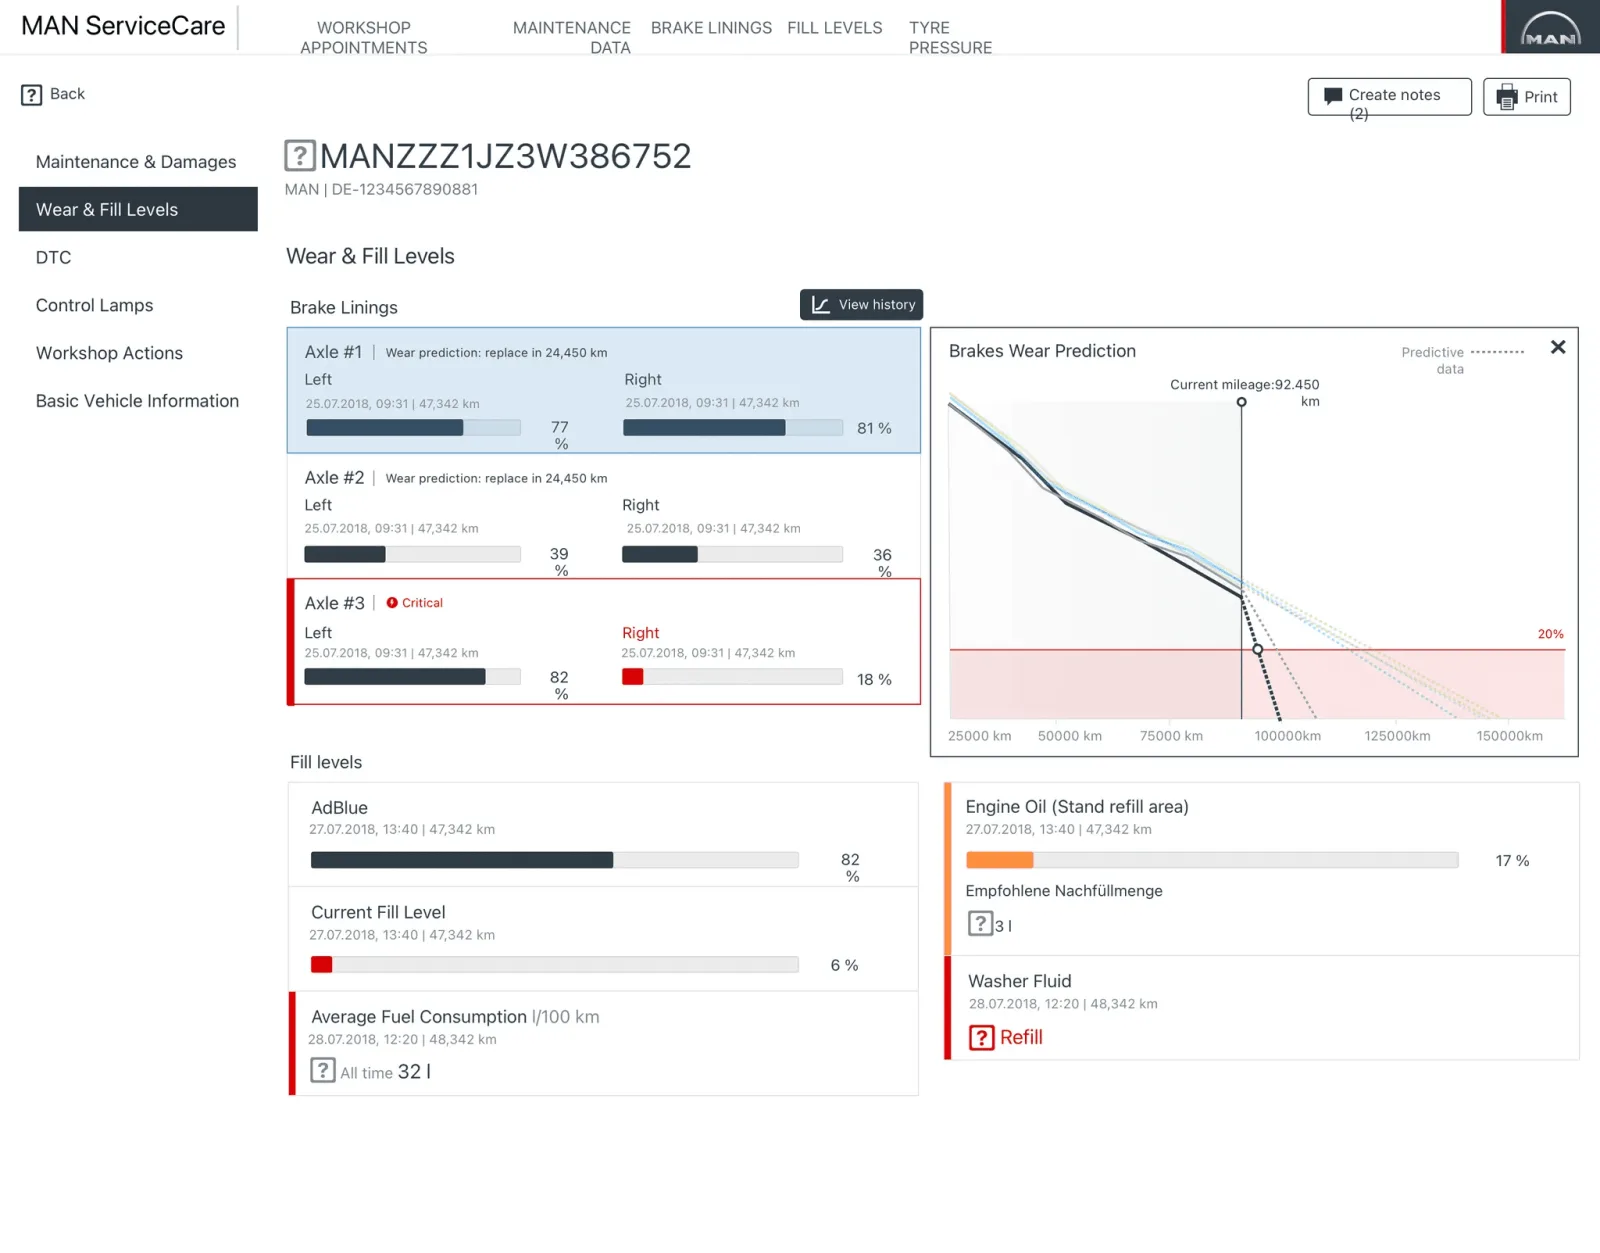
MAN Truck & Bus wanted the whole maintenance process in one place: fleet managers, workshops and drivers. Parts and service were the second largest income line, and that shaped every decision here.
It was prioritised because customers were leaving for other brands. Not over the trucks, over the information. They could not find out when a vehicle was due, could not see a fault before the driver reported it, and lost hundreds of euros a day per vehicle idle in a workshop waiting for a part nobody had ordered.
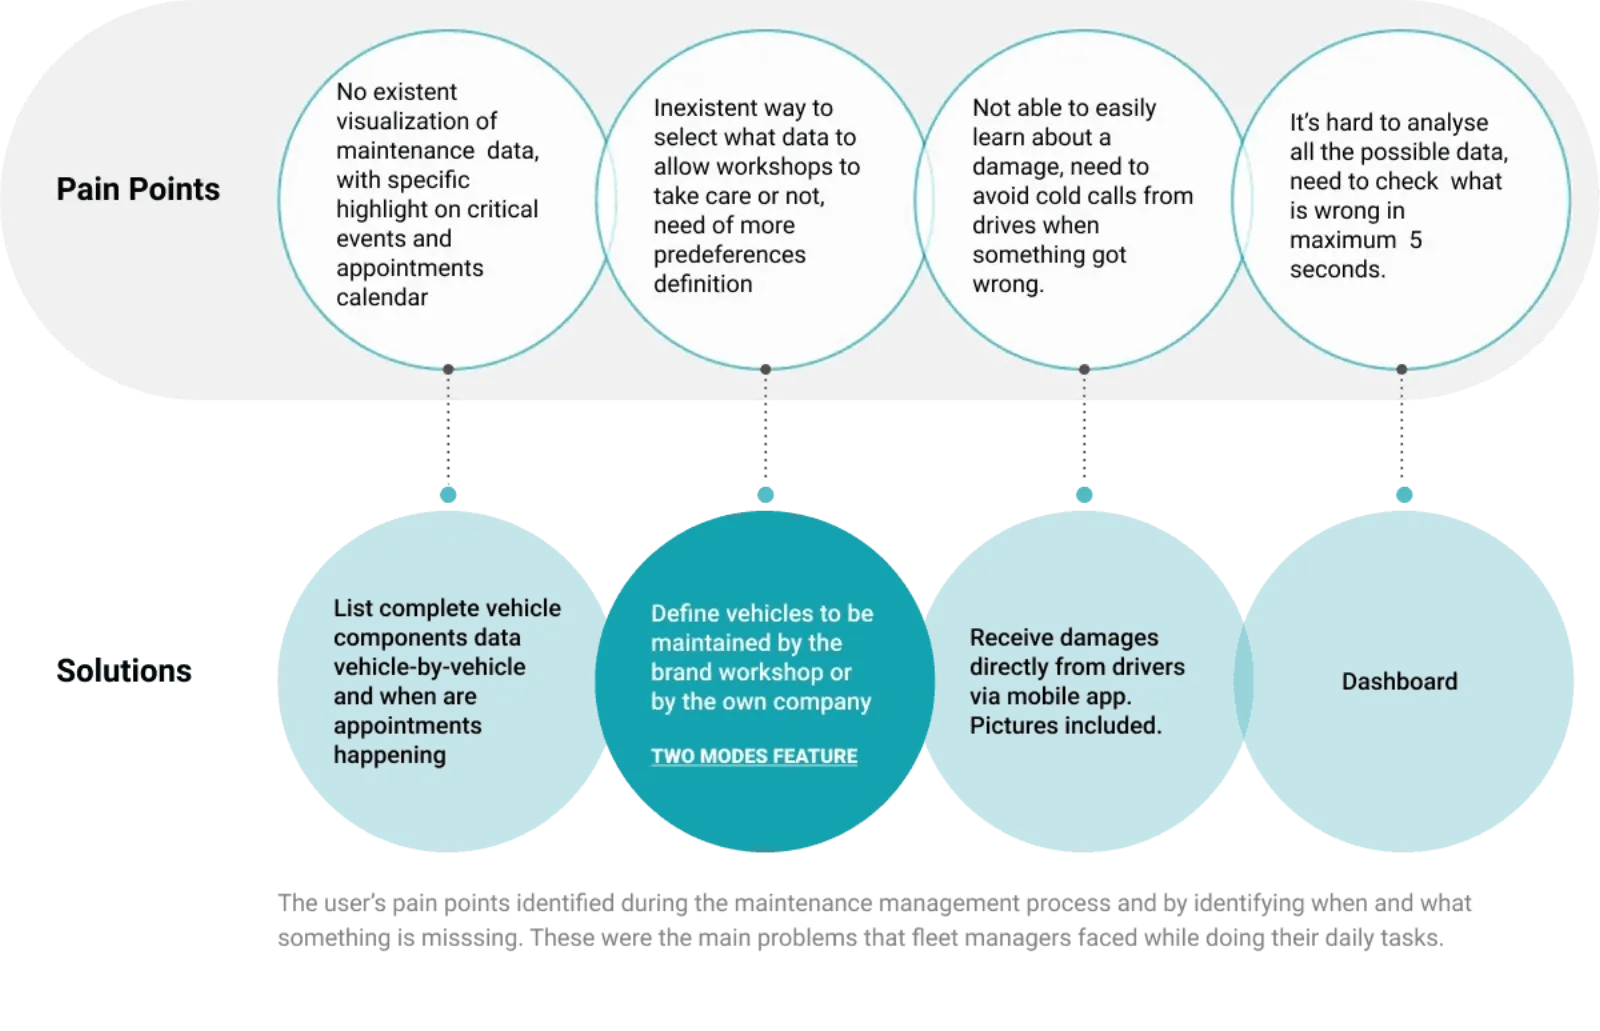
I ran field research on site in six countries, across fleets maintained by brand workshops and fleets with their own, large operators and small ones. Three constraints came out of it that shaped everything after:
- Fleets run to a thousand vehicles and beyond. Anything per-vehicle had to work in aggregate first.
- Fleet managers were at a desktop 20% of the time. The rest was the yard, the phone, the road.
- Users were 30 to 50, not technical, resistant to new process, not email people, and a meaningful share had visual limitations. Density was not a neutral choice.
What they said was consistent enough to quote directly:
“I need to see everything, at a glance. Just that.”
What I decided
Make the opt-out a real mode, not a disabled state
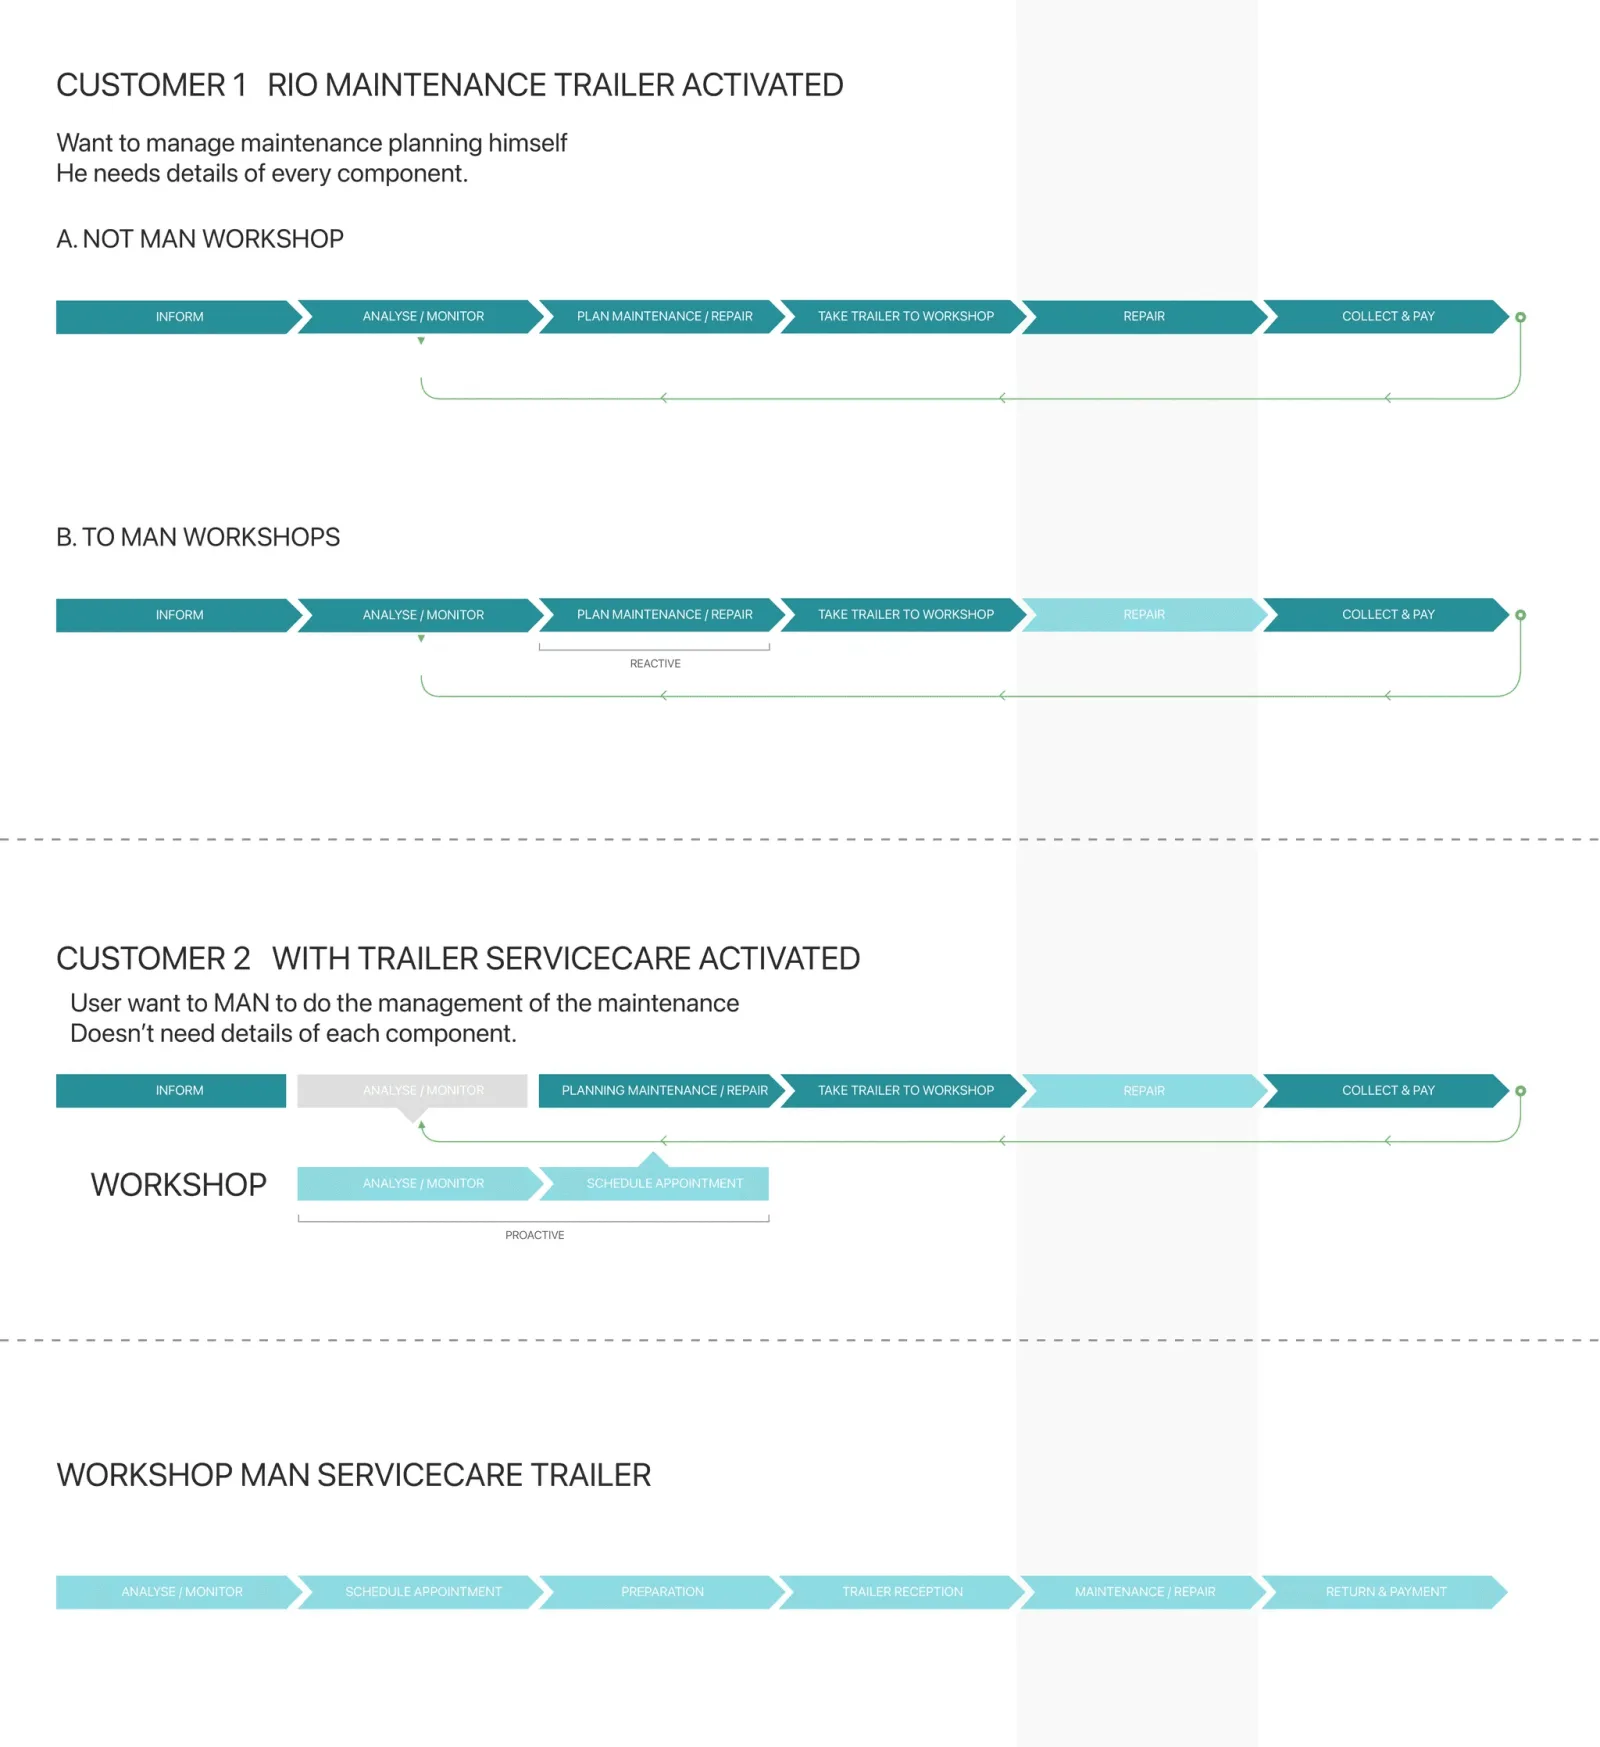
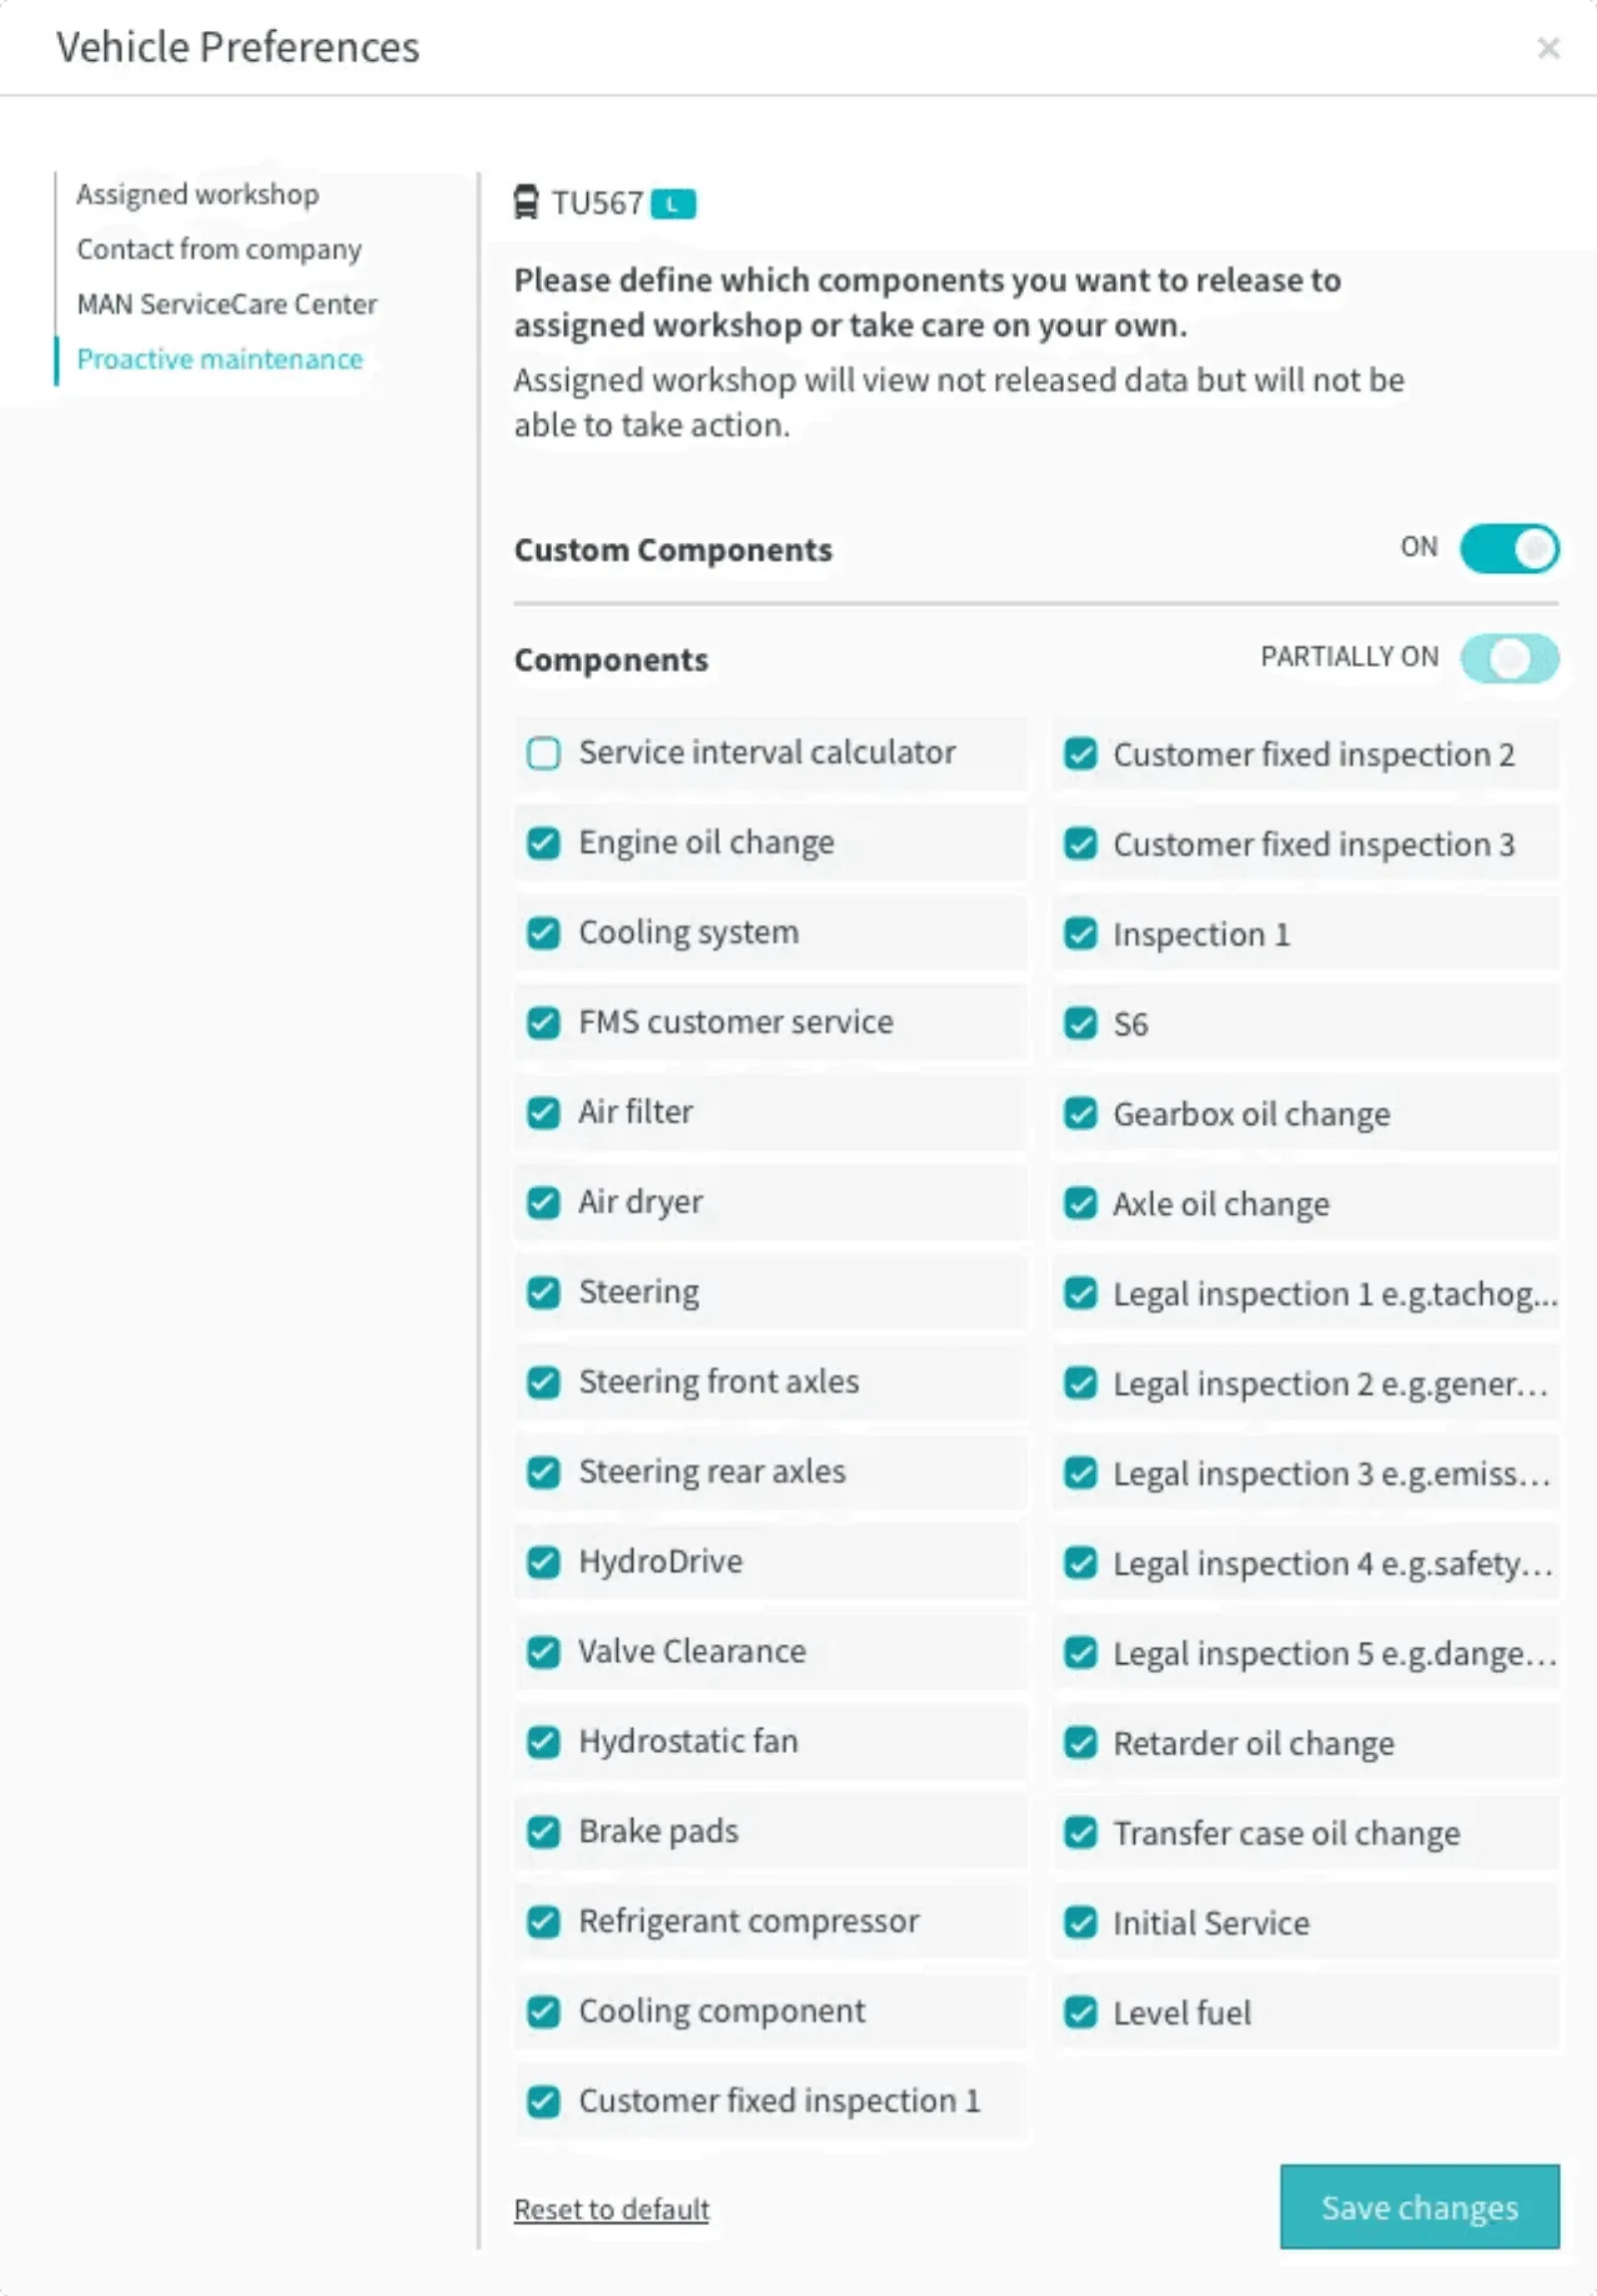
Proactive mode lets partner workshops read fleet data, spot problems and book appointments. Good for the customer, very good for the business, since parts and service are the second largest income line.
But the research kept returning one sentence: “I want to take care of all the maintenance by myself.” A large minority of fleets run their own workshops, and releasing their data to a dealer network is commercially hostile to them.
So manual mode is a real mode, not a disabled state. Data is hidden from every external workshop, shown in full for self-analysis, and the user books their own appointments. Building the refusal properly is what made the default worth trusting.
- Instead of
- A single proactive experience, where releasing vehicle data to partner workshops is simply how the product works.
- What it cost
- A second full experience to design, document and maintain, and fewer bookings for the workshop network.
Kill one of the two layouts in a week, rather than argue about it for a quarter
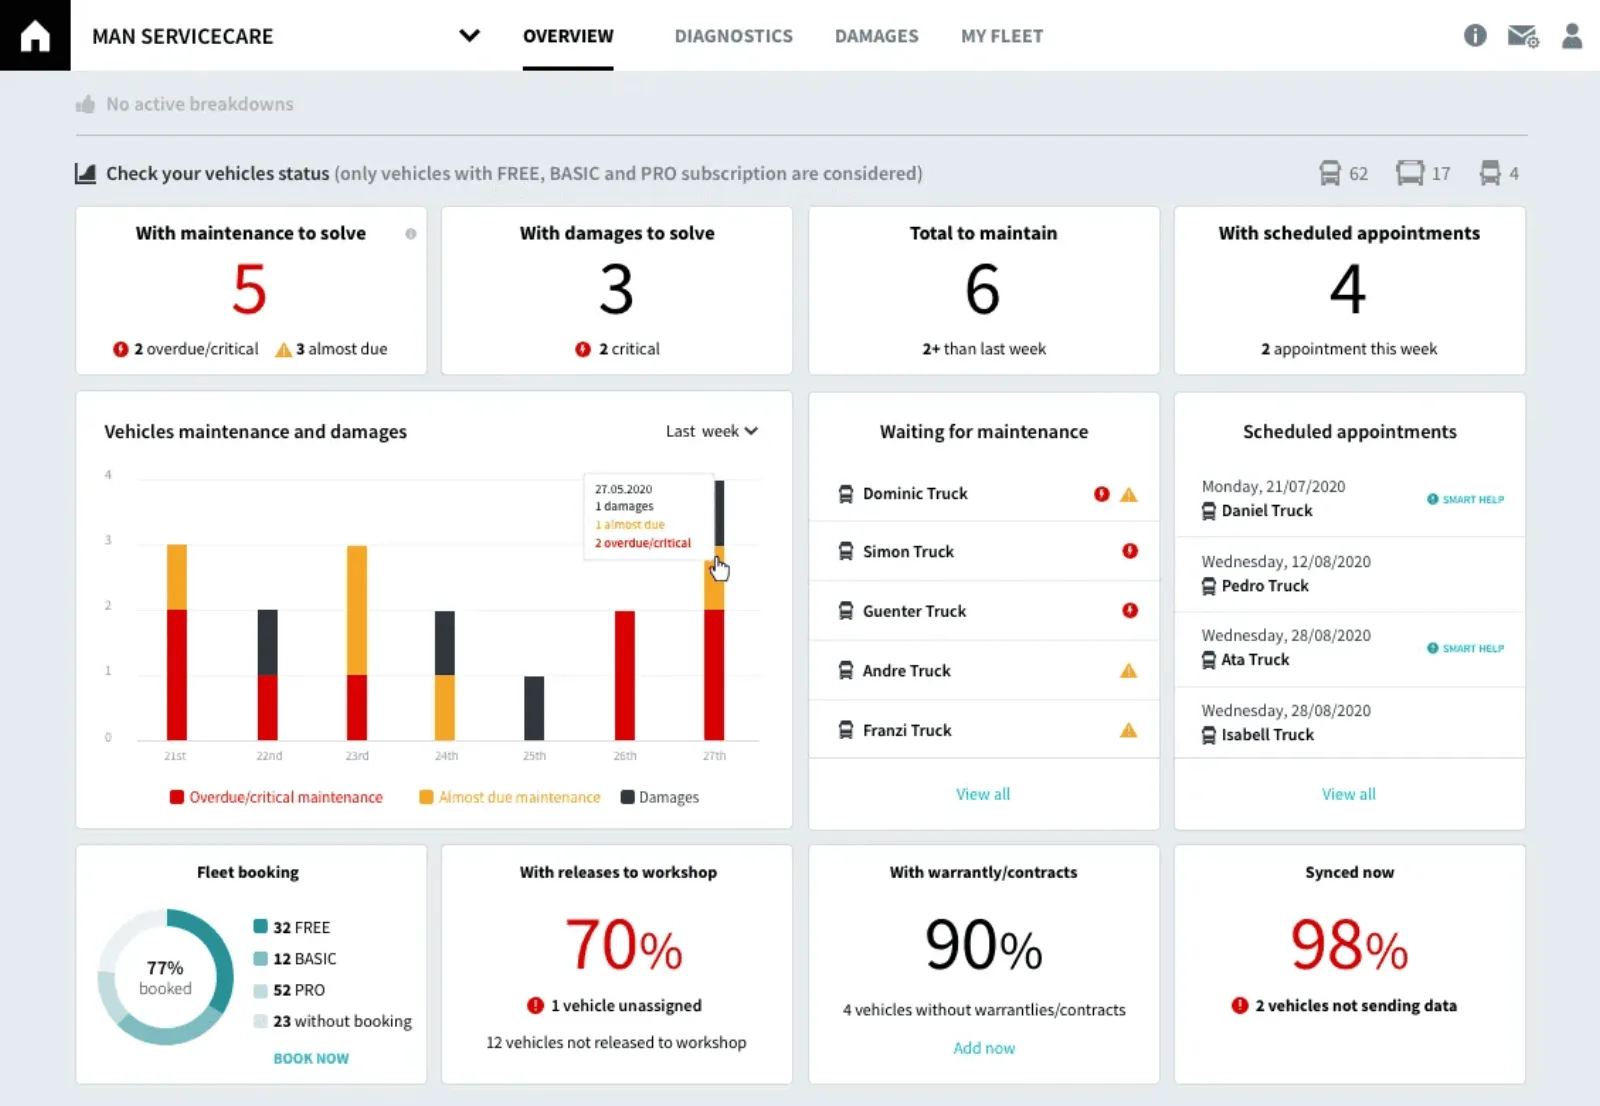
Overall KPIs with one large chart, against detailed KPIs with several small ones. Both defensible, both held strongly by different people. Discussion was never going to settle it, and the longer it ran the more of the build queue it blocked.
So I built both and let users end it. One layout died in a week. That is the cheapest way I know to kill an idea: not by winning the argument but by making it unnecessary. We ran the test twice, on the overview and on the brake lining detail, because I did not assume an answer from a summary screen would hold on a detail screen. It did not.
- Instead of
- Settling it in design review, which is where it had already stalled twice.
- What it cost
- Two production quality variants built knowing only one would survive.
Hold the direction solo after the service designer left
The Munich service designer left once the business case was validated. What remained was one frontend team, three backend teams in rotation, product owners, and a sales organisation that needed concepts faster than the build could produce them.
I ran a standing twice-weekly session with engineering and the product owner on open design questions, and shared every flow as a prototype so Sales could take it to customers and return with answers inside the week. I documented how each flow passed between fleet manager, workshop and driver, mostly so technical dependencies surfaced before they became rework.
- Instead of
- Handing the service-design layer back to the business, or letting it lapse.
- What it cost
- I became the only person holding the end-to-end view across four engineering teams, which is a single point of failure and I knew it.
Evidence
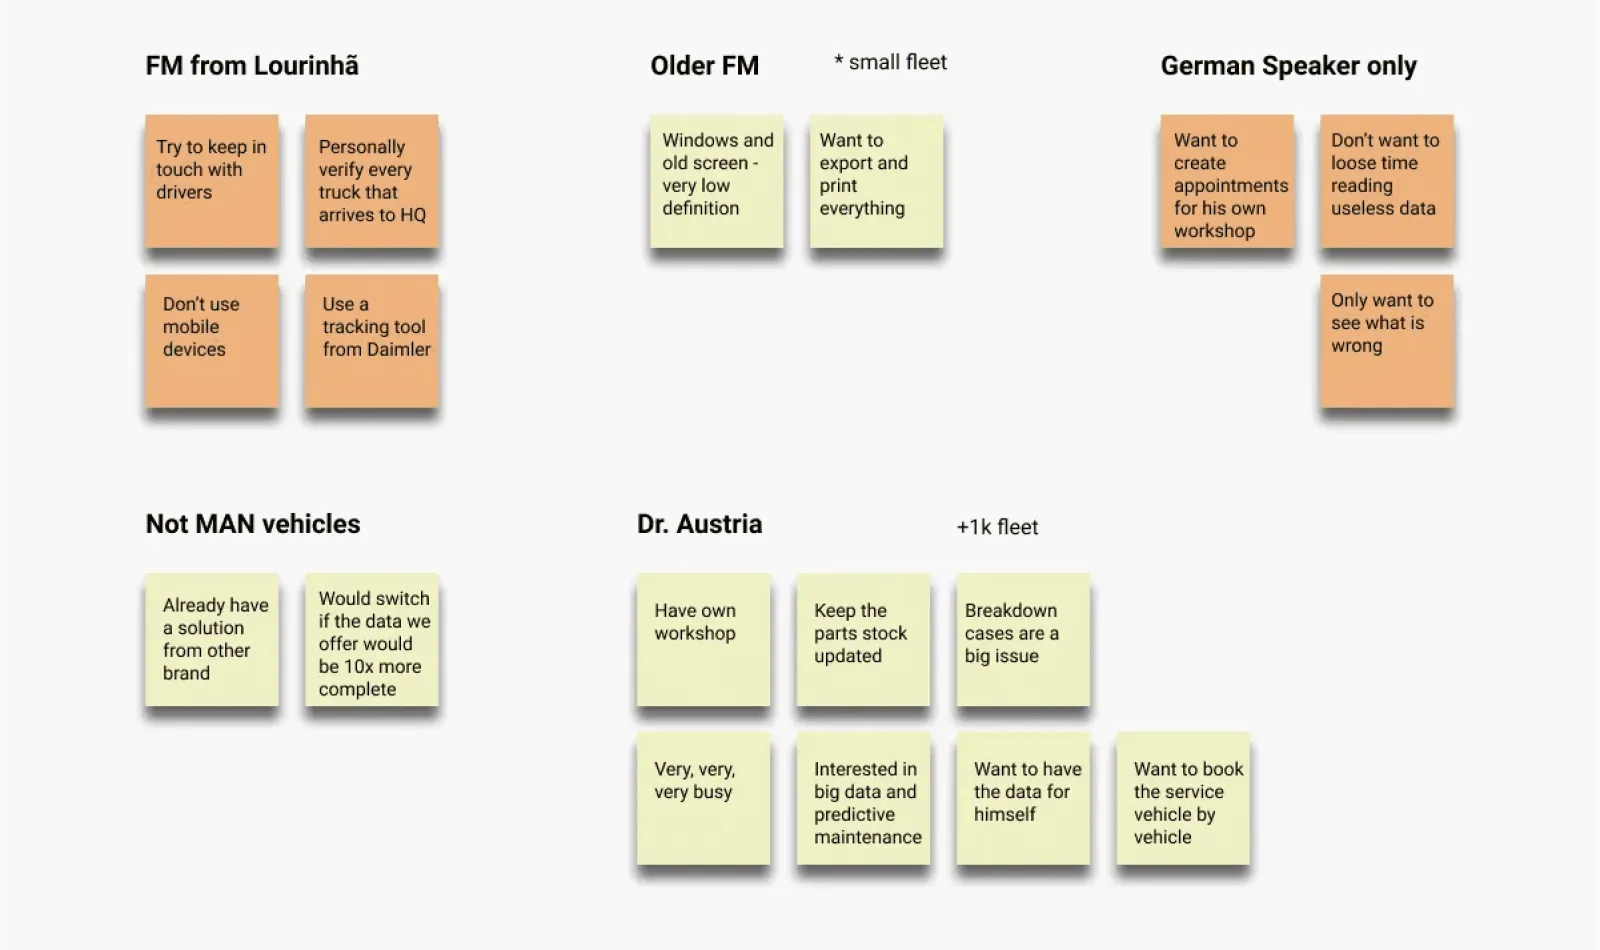
The research was grouped by who said it, not by theme. That is what showed the German speaking users and the small Portuguese operators wanting opposite things. Theme-grouping would have averaged them into one comfortable finding.
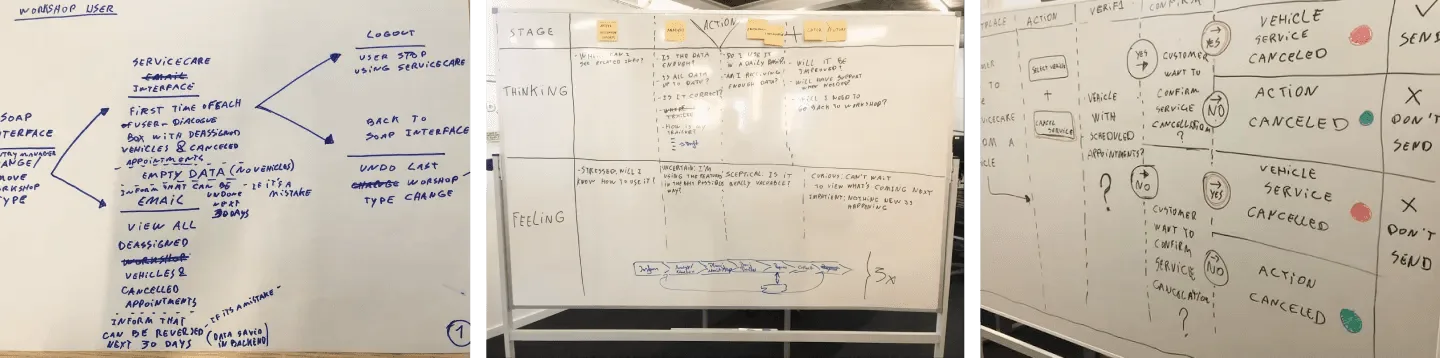
The sessions that mattered were about cancellation, not the happy path. What happens when a booked service falls through is the branch nobody specifies and every fleet eventually hits.
The failure I was designing against
A fleet manager who trusts this and misses something is worse off than one who never had it.
That sentence is the whole risk. Before this existed a manager checked by hand and knew they were guessing. Afterwards they stop checking, because a screen said it was fine. If the screen is wrong, the product has not just failed. It has removed the habit that caught the problem, and an idle vehicle costs hundreds of euros a day.
Two decisions on this page exist because of that, not because of a requirement:
- The cancelled service path. A booked appointment that falls through is the branch nobody writes a ticket for, and exactly where the system would quietly stop telling the truth. We worked it on a whiteboard before it was designed.
- Manual mode showing more, not less. A fleet that opts out of the dealer network sees full component detail, not a reduced view. Opting out of the service must not mean opting out of knowing.
I would now write this down at the start of a project as a matter of course. Here it was reasoning I carried rather than a document anyone could read, so it protected only the decisions I was in the room for.
What I would do differently
What I can state precisely is that more than 100 new fleets took on the brand’s digital products, and subscriptions grew 1 to 2% a week on a service bundled free with new vehicles. Session time and usage rose, and I watched it in Google Analytics at the time, but I do not have those figures and will not invent them. The experience improvement rests on a customer survey and what Sales heard, which is weaker than it sounds.
The deeper gap is that I never instrumented whether manual mode was right. It cost a great deal, I argued for it from interview quotes, and I still believe it. But I cannot tell you what share of fleets chose it, or whether they stayed longer. That is the question I now answer before committing a second experience.